Core Web Vitals & SEO: How They Impact Rankings in 2026 (Next.js Guide)
Core Web Vitals (LCP, CLS, and INP) are confirmed Google ranking signals in 2026 — functioning as a tiebreaker in competitive search results where content quality is comparable across the top pages. To maintain search visibility, your site should pass the 'Good' thresholds for all three metrics as measured by real-user data (CrUX), as a consistently failing score can put you at a structural disadvantage against equally-strong competitors.
Whether you are losing traffic to competitors with similar content or struggling to fix red metrics in PageSpeed Insights, this guide provides the exact benchmarks and technical strategies needed to optimize your site for Google’s performance algorithms.
In this guide, we will cover:
- What Core Web Vitals are and why they were created
- The three key metrics: LCP, CLS, and INP
- How Google uses CWV as a ranking signal and its role in mobile-first indexing
- Real-world case studies showing the impact
- How to diagnose a failing score and the tools to measure your own
- Actionable tips to improve each metric
 Core Web Vitals and SEO
What Are Core Web Vitals in SEO?
Core Web Vitals (CWV) are a set of standardized metrics that help Google evaluate the "user experience" of a webpage. Officially introduced as ranking factors in 2021, these metrics were created to bridge the gap between technical speed and human perception.
Historically, performance tools focused on "lab data" like Time to First Byte (TTFB) or First Contentful Paint (FCP). While useful for developers, these legacy metrics often failed to capture the frustration of a page that loads quickly but feels "janky" or unresponsive as a user tries to interact with it. Google introduced CWV to solve this by measuring three critical dimensions of real-user experience:
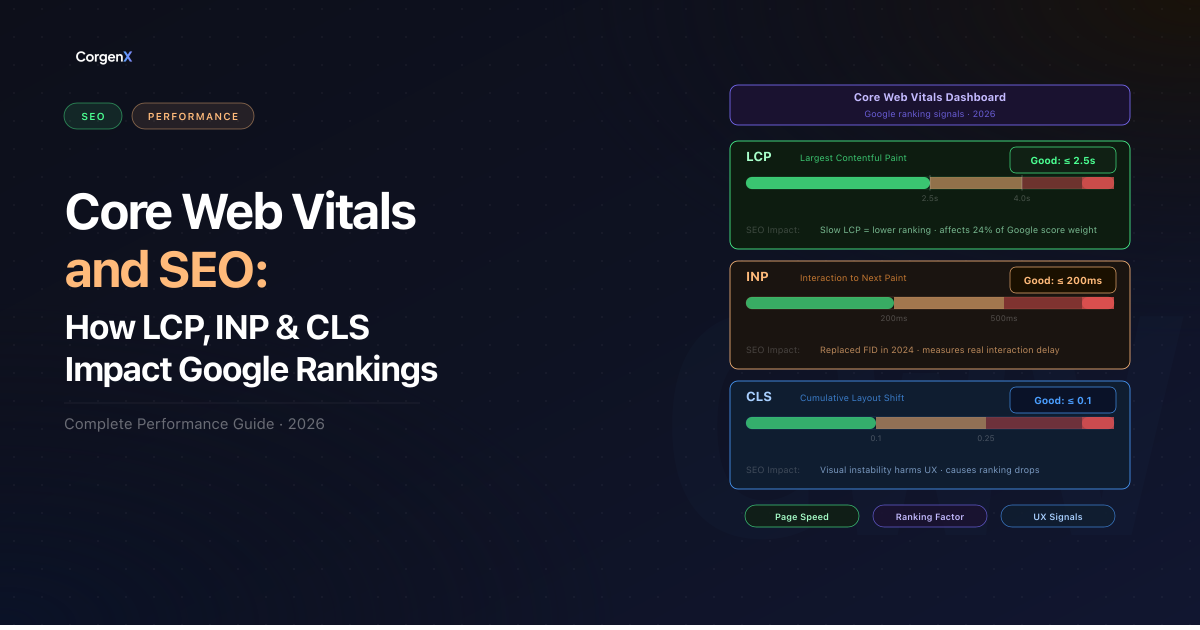
- Largest Contentful Paint (LCP) – measures loading performance
- Cumulative Layout Shift (CLS) – measures visual stability
- Interaction to Next Paint (INP) – measures responsiveness
 Figure 1: Comprehensive breakdown of Core Web Vitals metrics and their respective "Good" thresholds as defined by Google's Page Experience criteria.
The Three Core Web Vitals Metrics
To rank well, your site needs to meet specific thresholds for each metric. In simple terms, Google evaluates Core Web Vitals using the 75th percentile of real-user visits, meaning 75% of page visits must fall within the “Good” threshold to pass the assessment.
1. Largest Contentful Paint (LCP) — Loading Performance
LCP measures how long it takes for the largest visible element on the screen — usually a hero image or heading — to fully render after the page starts loading.
Thresholds: Good ≤ 2.5s | Needs Improvement 2.5s–4.0s | Poor > 4.0s
The Business Analogy: Imagine walking into a restaurant. LCP isn't the time it takes to get through the door; it's the time from sitting down to your main course arriving. If you're left staring at an empty table for too long, you'll likely leave regardless of how good the food eventually is.
Where to Diagnose First: Open Chrome DevTools, go to the Network tab, and look at the Waterfall. Identify your LCP element (usually a large image or heading) and check if it's being "discovered" too late. If the browser doesn't know about the image until the CSS or JS finishes loading, your LCP will suffer.
Common causes of poor LCP:
- Slow server response times (high TTFB)
- Render-blocking JavaScript and CSS
- Large, unoptimized images
- Custom fonts loaded without
font-display: swap loading="lazy"incorrectly applied to above-the-fold images
How to fix LCP in Next.js:
Use next/image with the priority prop on your hero image. This automatically injects a <link rel="preload"> in the document <head> — no manual preload tag needed:
import Image from 'next/image'

export default function Hero() {
  return (
    <Image
      src="/hero.webp"
      alt="Hero image"
      width={1200}
      height={630}
      priority          // preloads this image — use only on the LCP element
      quality={85}
    />
  )
}
Never apply priority to images below the fold — it wastes bandwidth. Use it on exactly one element per page: the LCP candidate.
2. Cumulative Layout Shift (CLS) — Visual Stability
CLS measures how much visible content unexpectedly jumps during page load. Every time an element shifts position without user interaction — a banner loading late, a font swapping in, an image without declared dimensions — it adds to your CLS score.
Thresholds: Good ≤ 0.1 | Needs Improvement 0.1–0.25 | Poor > 0.25
The Business Analogy: Imagine reading a newspaper where the paragraphs suddenly move down because a new advertisement was just pasted in the middle of your sentence. It's disorienting and often causes accidental clicks on things users didn't intend to touch.
Where to Diagnose First: In Chrome DevTools, open the Performance tab, record a page load, and look for "Layout Shift" markers in the timeline. DevTools will highlight exactly which elements shifted and what triggered the shift.
Common causes of poor CLS:
- Images or videos without explicit
widthandheightattributes - Ads, embeds, or iframes with no reserved space
- Web fonts causing FOUT (Flash of Unstyled Text)
- Content dynamically injected above existing content (cookie banners, notification bars)
How to fix CLS in Next.js:
next/image sets explicit dimensions automatically, which eliminates the most common source of layout shift. For responsive full-width images, use the fill prop with a positioned parent that has a declared aspect ratio:
import Image from 'next/image'

export default function BlogCover() {
  return (
    <div style={{ position: 'relative', aspectRatio: '16/9' }}>
      <Image
        src="/cover.webp"
        alt="Blog cover"
        fill
        sizes="(max-width: 768px) 100vw, 1200px"
        style={{ objectFit: 'cover' }}
      />
    </div>
  )
}
For fonts, use next/font — it inlines the CSS at build time and eliminates FOUT entirely, with zero runtime network request:
// app/layout.tsx
import { Inter } from 'next/font/google'

const inter = Inter({ subsets: ['latin'], display: 'swap' })

export default function RootLayout({ children }: { children: React.ReactNode }) {
  return (
    <html className={inter.className}>
      <body>{children}</body>
    </html>
  )
}
3. Interaction to Next Paint (INP) — Interactivity
INP measures the latency of all interactions throughout the user's entire visit — clicks, taps, and keyboard inputs. It replaced First Input Delay (FID) in March 2024 because FID only measured the first interaction, missing sluggishness that appears later in a session.
Thresholds: Good ≤ 200ms | Needs Improvement 200ms–500ms | Poor > 500ms
The Business Analogy: Imagine a doorbell that only rings three seconds after you press it. You aren't sure if it worked, so you press it again. On a website, this unresponsive feeling leads to frustration and high bounce rates.
Where to Diagnose First: Use the Performance tab in Chrome DevTools. Record a few interactions (clicks, taps) and look for the "Interactions" lane. Red bars indicate Long Tasks — JavaScript blocking the main thread for more than 50ms.
Common causes of poor INP:
- Heavy JavaScript execution blocking the main thread
- Large DOM sizes (over 1,500 nodes)
- Third-party scripts (ads, chat widgets, analytics) competing for main-thread time
- Expensive event handlers running synchronously on every click or keystroke
How to fix INP in Next.js:
Use next/dynamic to defer heavy components until after the page is interactive. This keeps the initial JS bundle lean and the main thread free for user interactions:
import dynamic from 'next/dynamic'

// Only loads when needed — not during initial page render
const HeavyChatWidget = dynamic(() => import('@/components/ChatWidget'), {
  ssr: false,
  loading: () => <div className="chat-placeholder" />,
})
For third-party scripts, use next/script with the right strategy to prevent them from blocking interactions:
import Script from 'next/script'

// afterInteractive: loads after hydration — use for analytics
<Script src="https://www.googletagmanager.com/gtag/js" strategy="afterInteractive" />

// lazyOnload: loads during idle time — use for chat widgets and non-critical scripts
<Script src="https://cdn.chatwidget.com/widget.js" strategy="lazyOnload" />
How Google Uses Core Web Vitals as a Ranking Signal
Core Web Vitals became part of Google's Page Experience signals in 2021. As of 2026, their importance has only intensified, as Google's algorithms have become more sophisticated at correlating site performance with user satisfaction and retention.
Core Web Vitals Report in Google Search Console
Google doesn't just use these metrics behind the scenes; they surface them directly to you. The Core Web Vitals report in Google Search Console is the most definitive proof of how Google views your site's performance. It categorizes your URLs as "Good," "Needs Improvement," or "Poor" based on real-user data (CrUX). If your pages are flagged here, it's a direct signal from Google that your rankings could be at risk. (Learn how to measure your own scores below).
CWV Are a Tiebreaker
Google has stated that CWV are used as a tiebreaker when two pages have similar relevance and content quality. If your page and a competitor's page are equally good in terms of content, the page with better CWV scores will likely rank higher.
Industry research suggests that pages with strong Core Web Vitals scores tend to perform better in organic search results, particularly when content relevance is comparable.
CWV and the Page Experience Signal
CWV are part of a broader signal set. Pages with strong Page Experience signals may perform better in search results when content quality is comparable. This signal includes:
- Core Web Vitals scores (LCP, CLS, INP)
- Mobile-friendliness
- HTTPS security
- No intrusive interstitials
Core Web Vitals Case Studies: Real Business Results
Optimizing for Core Web Vitals isn't just a technical exercise; it's a proven strategy for driving business growth. Here is how three major brands achieved significant results:
- Vodafone: By implementing Server-Side Rendering (SSR) for critical HTML and drastically reducing render-blocking JavaScript, Vodafone optimized their LCP by 31%.
- Yahoo! Japan: To solve a poor CLS score, Yahoo! News reserved specific space for hero images and advertisements, ensuring the page content didn't jump while loading.
- Tokopedia: This e-commerce giant used Svelte to build a "lite" version of their homepage for first-time visitors, significantly reducing resource size and improving LCP.
| Brand | Optimization | Results |
|---|---|---|
| Vodafone | 31% LCP Improvement | +8% Sales, +15% Lead-to-visit rate |
| Yahoo! Japan | 0.2 CLS Reduction | +15% Revenue per session, -13% Bounce rate |
| Tokopedia | 55% LCP Improvement | -23% Bounce rate, Increased session duration |
You don't need enterprise-level resources to see similar gains. Even relatively small changes — like fixing one large LCP image on your homepage or reserving space for a single banner ad — can meaningfully reduce your bounce rate and keep users engaged longer.
Detailed documentation can be found in the Google Web.dev Performance Case Studies.
How to Measure Your Core Web Vitals
Before you fix anything, you need to know what's actually failing and where. Google uses field data — real user visits collected via the Chrome User Experience Report (CrUX) — for ranking decisions, not lab simulations. Here is how to check both, step by step.
Step 1: PageSpeed Insights — Start With This
PageSpeed Insights shows you both field data and actionable lab diagnostics for any single URL in one place.
- Go to pagespeed.web.dev
- Paste the exact page URL you want to test and click Analyze
- Switch to the Mobile tab first — this is the data Google uses for ranking
- Check the "Field Data" section at the top — these are your real-world ranking signals from actual users
- Scroll to "Opportunities" and "Diagnostics" to find the specific elements causing failures
- Note which metric is failing: is LCP too slow, CLS too high, or INP elevated?
Note: If PageSpeed shows "Insufficient field data," your page doesn't have enough real-user visits in CrUX yet. Rely on lab data and DevTools until traffic grows.
Step 2: Google Search Console — Experience Report
GSC shows your CWV status across your entire site, grouped by URL patterns, using 28-day rolling field data.
- Open Google Search Console
- In the left sidebar, click Experience → Core Web Vitals
- You'll see two reports: Mobile and Desktop — always start with Mobile
- Click into the "Poor URLs" count to see which metric is causing failures and which pages are affected
- Click any URL group to see the specific failing metric and example URLs within that group
- After making fixes, click "Validate Fix" — Google monitors those pages for 28 days using real CrUX data and updates their status
GSC data updates on a 28-day rolling window. Allow 4–6 weeks after making fixes for scores to reflect in rankings.
Step 3: Chrome DevTools — Diagnose the Root Cause
DevTools is for finding exactly what is causing the failure — not for ranking assessment. Use it after PageSpeed tells you which metric is failing.
- Open Chrome and navigate to the page you want to debug
- Open DevTools (
F12on Windows /Cmd + Option + Ion Mac) - Go to the Lighthouse tab → check "Performance" → set device to Mobile → click Analyze page load
- For LCP: go to the Network tab, look at the Waterfall — is the LCP image discovered early or blocked behind JS/CSS?
- For INP: go to the Performance tab, click Record, interact with the page (click buttons, open menus), then stop. Look for red "Long Tasks" in the Main thread lane
- For CLS: expand the CLS audit in the Lighthouse report — it shows exactly which element shifted and what triggered it
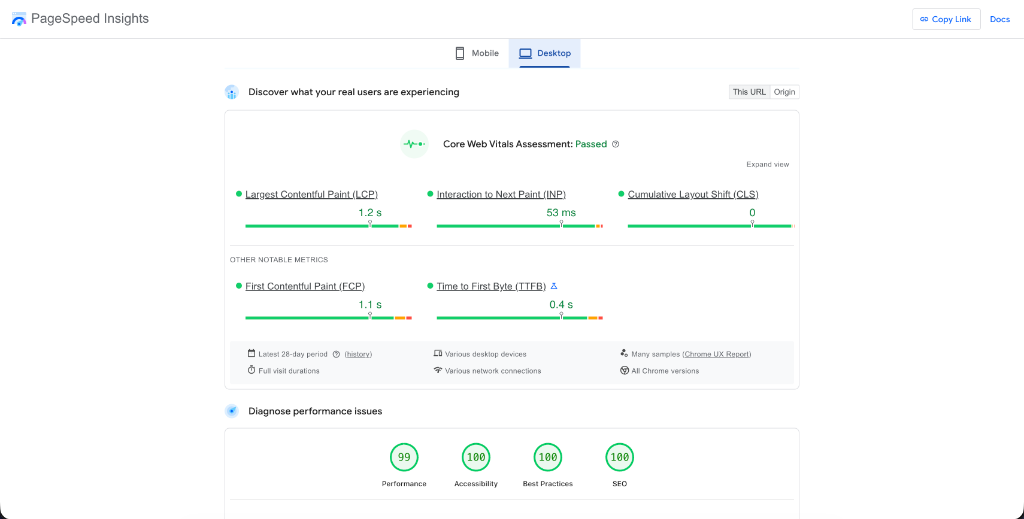 Figure 2: Real-world example of a PageSpeed Insights report showing a site passing the Core Web Vitals assessment with optimal scores.
How to Improve Core Web Vitals (LCP, CLS & INP)
Improving your scores requires a prioritized approach. Start with LCP, as it's often the most visible to users and carries significant weight in Google's ranking algorithms.
1. Improving LCP (Largest Contentful Paint) — Priority: High
The goal is to get your 'hero' content in front of the user as fast as possible by optimizing your delivery pipeline and server-side performance.
- Implement a Global CDN: Reduce the physical distance between your server and your users by using a Content Delivery Network (CDN) like Cloudflare or Akamai. This significantly lowers Time to First Byte (TTFB).
- Next-Gen Image Formats: Automatically serve images in WebP or AVIF formats. These provides superior compression compared to JPEG/PNG, reducing the bytes your LCP element needs to transfer.
- Server-Side Caching: Implement robust page-level caching so the server can deliver static HTML immediately without waiting for database queries.
2. Improving CLS (Cumulative Layout Shift) — Priority: Medium
Focus on creating a stable environment for dynamic content.
- Ad Slot Reservation: If you serve third-party ads, always wrap them in a container div with a fixed minimum height. This prevents the "jumping" effect when the ad eventually loads.
- Skeleton Loaders: For data-heavy components, use CSS-based skeleton screens. This gives the user a visual placeholder and reserves the exact dimensions required before the final content is injected.
3. Improving INP (Interaction to Next Paint) — Priority: High
Address the complexity of your site's JavaScript and DOM structure.
- Audit Third-Party Scripts: Every analytics tracker or chat widget competes for main-thread time. Audit your scripts and remove anything that isn't providing clear business value.
- Offload to Web Workers: For CPU-intensive tasks that don't need to touch the DOM, use Web Workers. This moves the processing off the main thread entirely, keeping it free for user interactions.
- Reduce DOM Depth: Large, deeply nested DOM trees (over 1,500 nodes) increase the cost of style recalculations and layout, directly impacting INP.
Need help implementing these fixes? Our Page Speed Optimization team can perform a deep-dive audit of your site and resolve your Core Web Vitals issues end-to-end, ensuring your site is lightning-fast and search-engine ready.
Mobile Core Web Vitals: Why Your Scores Differ
It is a common frustration: you run a test and see "Green" (Passing) scores on Desktop, but "Red" (Failing) scores on Mobile. Because Google uses mobile-first indexing, your mobile Core Web Vitals scores are what primarily influence your rankings.
Why Mobile Scores Are Usually Lower
Mobile devices face two major hurdles that desktops do not:
- Hardware Constraints: Mobile CPUs are significantly less powerful than desktop processors. This means JavaScript-heavy tasks (which impact INP) take longer to execute, leading to higher latency.
- Network Volatility: Even on 5G, mobile connections are less stable than wired or fiber-optic broadband. A large hero image that loads in 1 second on desktop might take 4 seconds on a throttled mobile connection, directly hurting your LCP.
How to Check Mobile Scores Separately
When using PageSpeed Insights, always pay attention to the tabs at the top of the report. The "Mobile" tab is selected by default for a reason—it's the most critical for SEO. Ensure you are optimizing based on the mobile opportunities listed, such as reducing execution time for third-party scripts or serving properly scaled images.
Common Mobile-Specific Pitfalls
- Touch Target Sizes: If buttons or links are too close together, it takes more processing power for the browser to determine which element was clicked. This "fat-finger" latency can increase your INP score.
- Viewport Shifts: Elements that don't shift on a 27-inch monitor might create massive layout shifts on a 6-inch phone screen. Always test your CLS using the mobile emulator in Chrome DevTools.
Core Web Vitals Benchmarks (2026)
To achieve a "Good" rating, your site must meet these specific thresholds at the 75th percentile of all users:
| Metric | Good | Needs Improvement | Poor |
|---|---|---|---|
| LCP | ≤ 2.5s | 2.5s – 4.0s | > 4.0s |
| INP | ≤ 200ms | 200ms – 500ms | > 500ms |
| CLS | ≤ 0.1 | 0.1 – 0.25 | > 0.25 |
If your website meets all three thresholds at the 75th percentile of real mobile users, Google will classify the page as "Passing Core Web Vitals."
Important Note on "Partial Passes": Google's assessment is "all or nothing"—your page is only considered "Passing" if it hits the "Good" threshold for all three metrics. If even one metric (e.g., LCP) falls into "Needs Improvement" or "Poor," the entire page will fail the Core Web Vitals assessment in Google Search Console. Google prioritizes mobile data for these signals, so while desktop scores are important, mobile performance is what directly impacts your mobile-first indexing rankings.
Common Core Web Vitals Mistakes to Avoid
Even with the best intentions, it is easy to make mistakes that inadvertently hurt your scores. Here are the most common traps to avoid:
- Optimizing Only for Lab Scores: A 100/100 Lighthouse score is great for morale, but if your field data (CrUX) shows users on slow devices are struggling, Google will still flag your site. Always prioritize the real-world data in Google Search Console.
- Over-Lazy-Loading Images: Lazy-loading is a best practice for images further down the page, but adding
loading="lazy"to your hero image or any "above-the-fold" content is a common LCP killer. These critical elements should load as early as possible. - Ignoring Mobile Disparities: Many developers test primarily on high-end desktop machines. Because of mobile-first indexing, a site that passes on desktop but fails on mobile is still considered "failing" by Google's ranking algorithms.
- Third-Party Script Bloat: Every chat widget, tracking pixel, and cookie banner adds weight to the main thread. If you have too many, your INP will suffer as the browser struggles to process user inputs while running heavy third-party code.
- Missing Geometric Attributes: Failing to set
widthandheightattributes (or CSS equivalent) on images and ad slots is the #1 cause of poor CLS. Browsers need to know how much space to reserve before the asset actually finishes downloading.
Next.js-Specific Optimisations for Core Web Vitals
Next.js provides built-in primitives that directly target each Core Web Vital. These aren't workarounds — they're purpose-built APIs that require minimal configuration and deliver significant results on all three metrics.
1. next/image — Fix LCP and CLS Simultaneously
The next/image component automates five optimisations at once: converts images to WebP/AVIF, prevents layout shift by reserving space, lazy-loads below-fold images, generates responsive srcset attributes, and exposes the priority prop to preload the LCP element. Using a raw <img> tag in a Next.js project means opting out of all of them.
import Image from 'next/image'

// Hero image — priority preloads it as the LCP element
export default function Hero() {
  return (
    <Image
      src="/hero.webp"
      alt="Hero image"
      width={1200}
      height={630}
      priority
      quality={85}
    />
  )
}

// Responsive card image — fill + sizes prevents oversized downloads on mobile
export function ProductCard({ src, alt }: { src: string; alt: string }) {
  return (
    <div style={{ position: 'relative', aspectRatio: '4/3' }}>
      <Image
        src={src}
        alt={alt}
        fill
        sizes="(max-width: 640px) 100vw, (max-width: 1024px) 50vw, 400px"
        style={{ objectFit: 'cover' }}
      />
    </div>
  )
}
The sizes prop is critical — without it, the browser downloads the full-resolution image on every viewport, including mobile. With it, Next.js generates a srcset and the browser picks the right size.
2. next/font — Eliminate Font-Related CLS and LCP Delays
Loading Google Fonts via a <link> tag causes two problems: a blocking network request that delays rendering, and FOUT (Flash of Unstyled Text) that causes layout shift. next/font solves both by downloading fonts at build time and inlining the CSS — zero runtime network request, zero layout shift.
// app/layout.tsx
import { Inter, Roboto_Mono } from 'next/font/google'

const inter = Inter({
  subsets: ['latin'],
  display: 'swap',
  variable: '--font-inter',
})

const robotoMono = Roboto_Mono({
  subsets: ['latin'],
  display: 'swap',
  variable: '--font-roboto-mono',
})

export default function RootLayout({ children }: { children: React.ReactNode }) {
  return (
    <html lang="en" className={`${inter.variable} ${robotoMono.variable}`}>
      <body>{children}</body>
    </html>
  )
}
If you are currently loading fonts with @import url('https://fonts.googleapis.com/...') in your CSS, switching to next/font is the single fastest CLS win available in a Next.js project.
3. next/dynamic — Reduce INP by Shrinking the Initial JS Bundle
Every kilobyte of JavaScript loaded at startup is time the main thread spends parsing and executing instead of responding to users. next/dynamic splits heavy components into separate chunks that only download when they are actually needed.
import dynamic from 'next/dynamic'

// Chart library — only loads when this section renders
const AnalyticsChart = dynamic(() => import('@/components/AnalyticsChart'), {
  ssr: false,
  loading: () => <div className="h-64 bg-slate-100 animate-pulse rounded-xl" />,
})

// Modal — only loads when the user triggers it, not at page load
const ContactModal = dynamic(() => import('@/components/ContactModal'))

// Below-fold section — deferred entirely until scrolled into view
const TestimonialsSection = dynamic(() => import('@/components/Testimonials'))
Rule of thumb: dynamically import any component that uses a heavy third-party library (chart.js, three.js, rich text editors), any large interactive widget, and any section that is not visible in the initial viewport.
4. next/script — Control When Third-Party Scripts Run
Third-party scripts are the leading cause of poor INP. Every analytics tracker, chat widget, and cookie banner competes with user interactions for main-thread time. next/script gives you explicit control over when each script loads relative to page hydration:
import Script from 'next/script'

export default function Layout({ children }: { children: React.ReactNode }) {
  return (
    <>
      {children}

      {/* Analytics — load after hydration, before user interactions */}
      <Script
        src="https://www.googletagmanager.com/gtag/js"
        strategy="afterInteractive"
      />

      {/* Chat widget — lowest priority, loads during browser idle time */}
      <Script
        src="https://cdn.intercom.io/widget.js"
        strategy="lazyOnload"
      />
    </>
  )
}
| Strategy | When It Loads | Best For |
|---|---|---|
beforeInteractive | Before hydration | Critical polyfills only |
afterInteractive | After hydration | Analytics, tag managers |
lazyOnload | During browser idle time | Chat widgets, social embeds |
worker (experimental) | Web Worker thread | CPU-heavy scripts that don't touch the DOM |
Moving scripts from unmanaged <script> tags to next/script with lazyOnload can meaningfully reduce INP on pages with multiple third-party integrations — the exact gain depends on which scripts are loaded and your users' device speeds.
5. Bundle Size Reduction
Even without third-party scripts, a bloated application bundle hurts INP by keeping the main thread busy during page load. Use Next.js's built-in bundle analyser to find and eliminate oversized dependencies:
npm install @next/bundle-analyzer
// next.config.js
const withBundleAnalyzer = require('@next/bundle-analyzer')({
  enabled: process.env.ANALYZE === 'true',
})
module.exports = withBundleAnalyzer({})
ANALYZE=true npm run build
The output is a visual treemap of your entire bundle. Common high-impact swaps: replace lodash with native JS methods, replace moment.js with date-fns, and replace full icon library imports (import { ... } from 'lucide-react') with individual imports to ensure tree shaking works correctly.
Start Improving Your Core Web Vitals Today
Core Web Vitals represent a fundamental shift in how Google evaluates site quality. Improving these scores has real business impact beyond rankings.
One often-overlooked contributor to poor crawl efficiency is broken links — dead URLs force Googlebot to waste crawl budget on 404 errors instead of your valuable pages. Before addressing CWV fixes, it is worth running a quick broken link audit to clear those dead ends first.
At CorgenX, our Technical SEO and Page Speed Optimization teams work together to ensure your site isn't just beautiful, but lightning-fast and search-engine ready. Start by running your site through PageSpeed Insights, identify your biggest opportunities, and tackle them one metric at a time.
FAQs
Do Core Web Vitals directly affect rankings?
Yes, but with an important nuance. Core Web Vitals are a confirmed Google ranking signal, but they function primarily as a tiebreaker rather than a dominant factor. Google has been explicit that strong content with poor CWV can still outrank thin content with perfect scores. In practice, CWV matter most in competitive SERPs where content quality is comparable across the top results — that's when a superior Page Experience score is the deciding factor. For most sites, fixing failing CWV is unlikely to cause dramatic overnight ranking jumps, but a consistently poor score is a ceiling that limits how high you can climb for competitive keywords. Think of it as table stakes: passing CWV won't win you the game, but failing them puts you at a structural disadvantage against equally-good competitors.
How often does Google update Core Web Vitals thresholds?
Google reviews Core Web Vitals thresholds annually and signals upcoming changes well in advance — typically 6–12 months before they take effect — through the web.dev blog and Search Central documentation. The most significant change to date was in March 2024, when INP replaced FID as the interactivity metric, a shift that had been announced over a year earlier. Before that, the LCP and CLS thresholds set in 2020 remained stable for four years. As of 2026, the current thresholds (LCP ≤ 2.5s, CLS ≤ 0.1, INP ≤ 200ms) remain unchanged from the INP rollout. The safest approach is to subscribe to the Chrome Developers blog to receive advance notice of any threshold or metric changes.
What is a good Core Web Vitals score?
A "Good" Core Web Vitals score means all three metrics pass their thresholds at the 75th percentile of real user visits: LCP at or under 2.5 seconds, CLS at or under 0.1, and INP at or under 200ms. Google's assessment is all-or-nothing — your page is only classified as "Passing" in Google Search Console if all three metrics hit "Good" simultaneously. A page that scores Good on LCP and INP but has a CLS of 0.15 is still classified as failing. The goal is not to optimize one metric in isolation but to bring all three into the "Good" range as measured by real mobile users over a 28-day window. Desktop scores are measured separately and matter for desktop rankings, but mobile is the primary signal.
How do I check my Core Web Vitals in Google Search Console?
Open Google Search Console and click Experience in the left sidebar, then select Core Web Vitals. You will see two reports — Mobile and Desktop. Always start with Mobile since Google uses mobile-first indexing. The report groups your URLs into "Good," "Needs Improvement," and "Poor" categories based on real CrUX field data. Click into any "Poor URLs" count to see which specific metric is causing the failure and which pages are affected. Once you have made fixes to those pages, click "Validate Fix" on the failing URL group — Google will then monitor those pages for 28 days and update their classification if the field data improves. For checking a single URL immediately, go to pagespeed.web.dev and paste the URL directly.
What is the fastest way to fix a poor LCP score in Next.js?
The single highest-impact change is adding the priority prop to your hero image in next/image. This automatically injects a <link rel="preload"> tag in the document <head>, ensuring the browser discovers and starts downloading the LCP image before any JavaScript runs — often shaving 0.5–1.5 seconds off LCP with a single prop change. Second, check that you are not applying loading="lazy" to any above-the-fold image — this actively delays the LCP element and is one of the most common self-inflicted LCP problems. Third, if you are loading a custom font via a <link> tag or CSS @import, switch to next/font — font render-blocking is frequently a secondary cause of slow LCP that gets overlooked. These three changes combined — priority on the hero image, no lazy-loading above the fold, and next/font for typefaces — resolve the majority of LCP issues in Next.js applications without requiring any server-side infrastructure changes.
Related Articles
Ready to Scale?
Our high-performance web solutions and SEO strategies are designed to deliver results.
Check out our services